Practice Marketing
September 8, 2026 · by Brent Stutzman
We analyzed over 22,000 page views on 3 therapy websites. Here's where people actually go.
Ever wonder where people actually go on your practice website? 🤔
Not where you hope they go. Where they actually click, how long they stay, and what they read right before they reach out.
I've been doing SEO and Google Analytics for therapy practices for over ten years. This is still the question most practice owners are guessing at.
So we stopped guessing. We pulled 90 days of Google Analytics from three practices we work with: a 17-clinician child therapy group in the Chicago suburbs, a 4-clinician practice in Jacksonville, and a 9-clinician child and family practice in Parker, Colorado.
Three markets. Three team sizes. Three different site structures.
22,833 page views. Same result, every time.
Set the blog aside, and roughly 8 out of every 10 visits land on just three page types. Your homepage, your clinician and team pages, and your service pages.
That's where the decision gets made. Two of those three are pages most practices barely touch after launch.
Here's the data, what it means, and what to do about it this week.
How we ran this
- Three practices, three cities. Anonymized to the city. No practice or clinician names.
- 90 days: June 10 through September 7, 2026, pulled from each site's Google Analytics 4 Pages and Screens report.
- Blog excluded from the splits. Blog traffic is mostly national readers, not local prospects. This post is about the pages that turn a local search into an inquiry.
- Team pages are counted with clinician bios. A "meet our team" page exists to route people to a bio, so the two belong in one category.
Every number below reconciles to the totals. Every chart carries its source.
Same pattern. Every site.
These three practices share nothing. Not a market, not a team size, not a site design.
They sent their non-blog traffic to the same handful of pages, in nearly the same proportions.
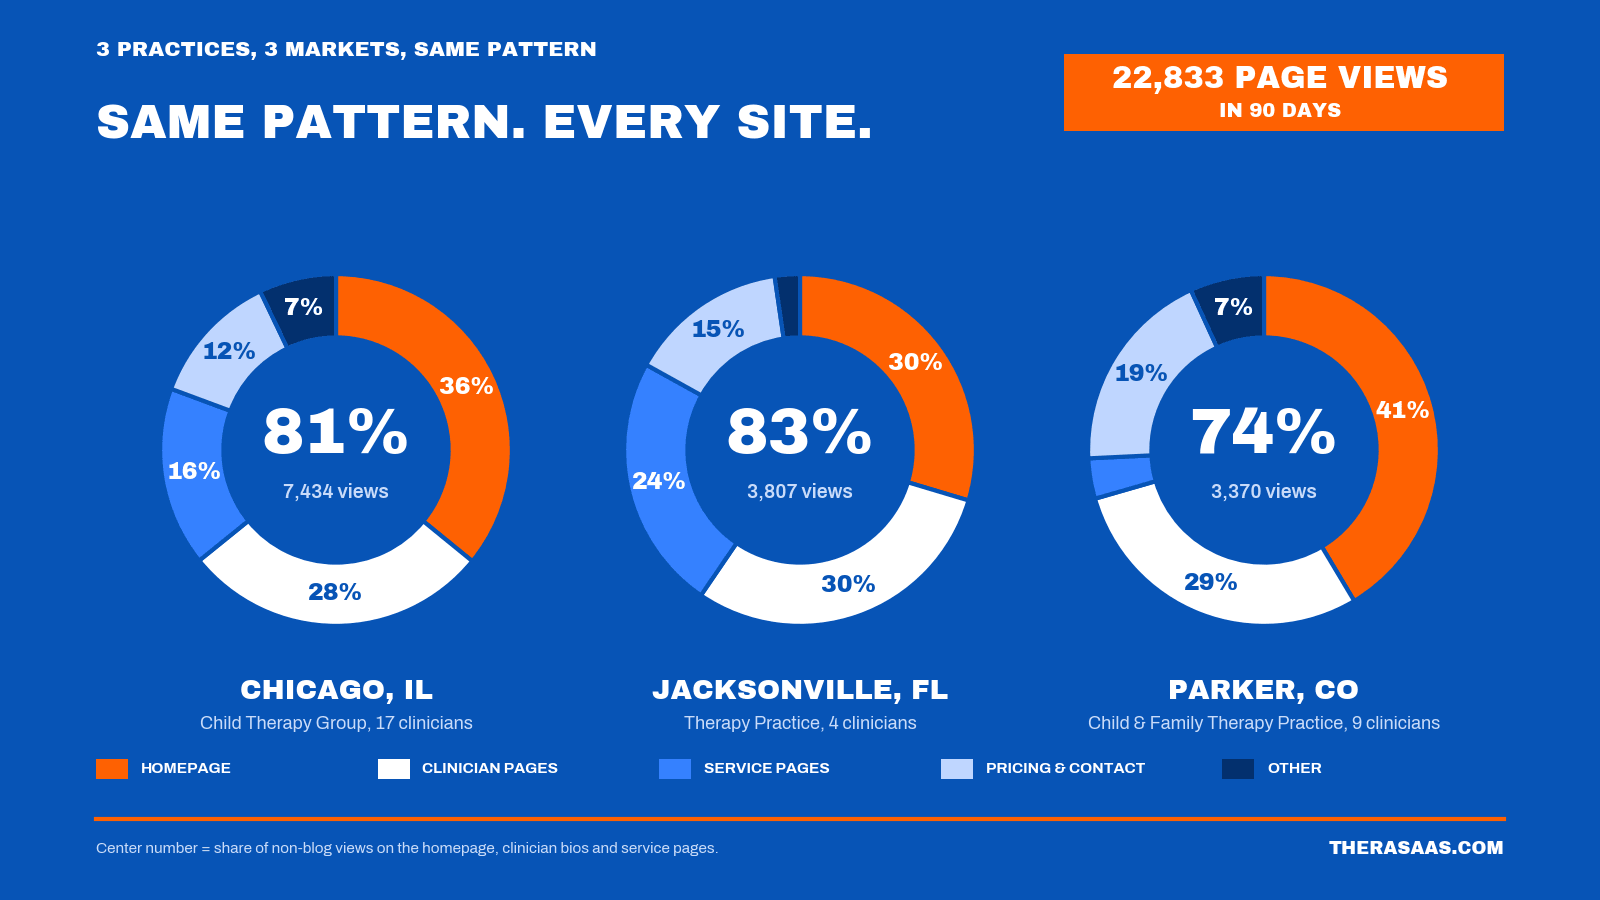
Where non-blog visits go
Same pattern. Every site.
Center number = share of non-blog views on the homepage, clinician bios and service pages. Hover a segment for its own numbers, or click a page type below to spotlight it across all three sites.
Chicago, IL
Child therapy group · 17 clinicians
7,434 non-blog views
Jacksonville, FL
Therapy practice · 4 clinicians
3,807 non-blog views
Parker, CO
Child & family therapy practice · 9 clinicians
3,370 non-blog views
Source: Google Analytics 4, 90 days, 3 practices · TheraSaaS.com
Chicago: 81% of non-blog views landed on the homepage, clinician and team pages, and service pages. Jacksonville: 83%.
Parker came in at 74%. The only reason it's lower is that Parker has one service page getting real traffic, so its visitors go straight from the homepage to payment and insurance, then to the team.
Three different practices. One visitor path.
If you've been spreading your energy evenly across forty pages, the data says stop. Five page types carry the whole site.
Your bios are your best salespeople
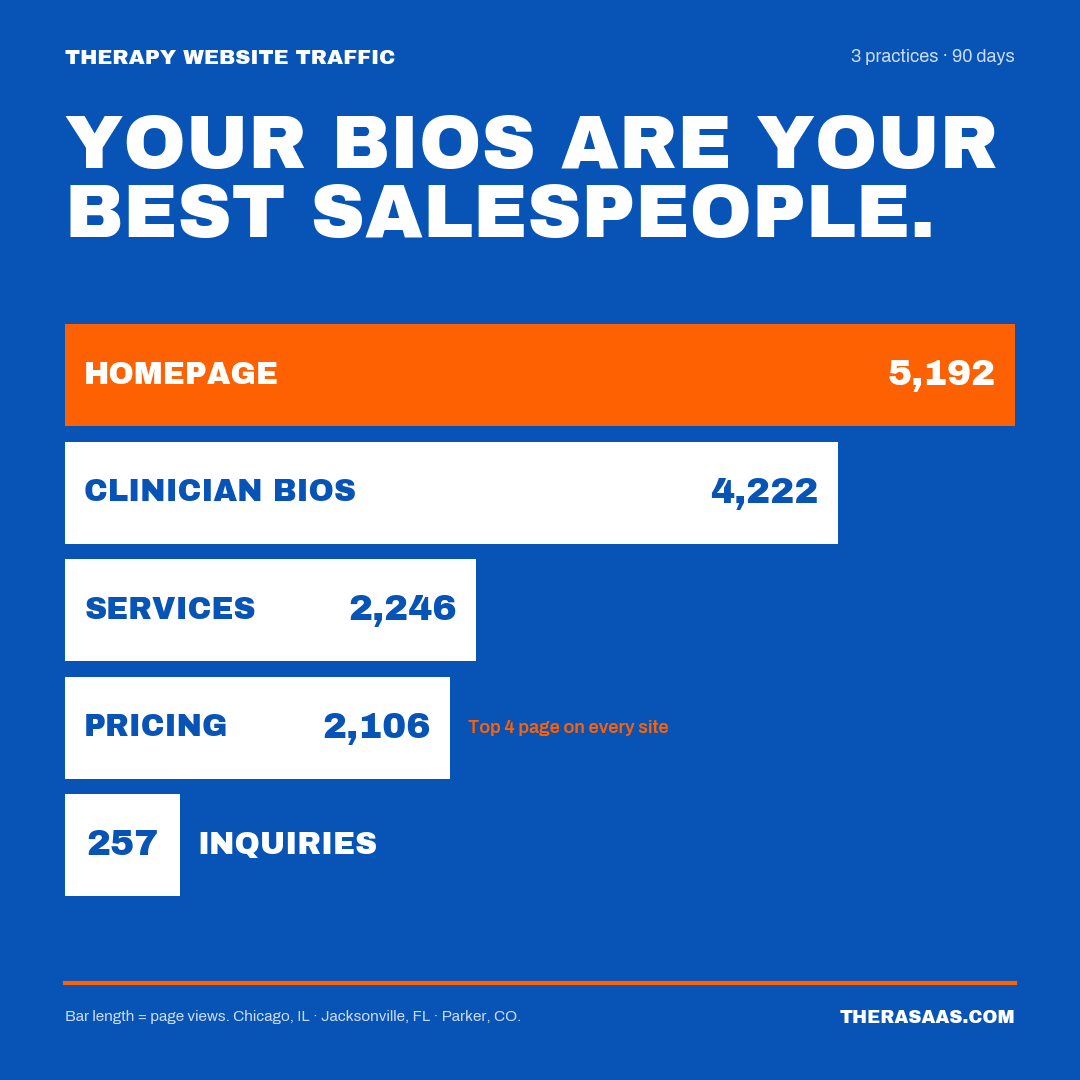
Here's the number that surprised the practice owners most. Across all three sites, clinician and team pages pulled 4,212 views.
That is second only to the homepage, and nearly double the service pages.
Look at the Jacksonville practice. Four clinicians, and the bio pages together pulled 1,132 views.
The homepage pulled 1,128.
The bios beat the homepage. One clinician's bio was the number-two page on the entire site, and people spent 52 seconds there. That is more than double the homepage.
In Chicago, the team page drew 1,007 views with an 82% engagement rate and 2.1 views per user. People come back to it.
It's the "browse the menu" page. Every bio below it lives or dies on how well it works.
A parent or client chooses a person, not a practice.
If a bio is two paragraphs of credentials, a headshot from 2019, and no button to book, that page is leaking the most qualified visitors you have.
Top pages
The same five page types, on every site.
Bar length = page views. Every clinician bio and team page is combined into one row. Hover a row for users and engagement. Blog posts excluded.
Source: Google Analytics 4, 90 days, 3 practices · TheraSaaS.com
Flip through the three tabs. Roll every bio and team page into one line, and it's a top-two page on every site. In Jacksonville, it edges past the homepage.
After that it's pricing or insurance, contact, and one or two service pages earning their keep in search. On the Parker site, bios and the team page took six of the top ten spots on their own.
Where TheraSaaS comes in
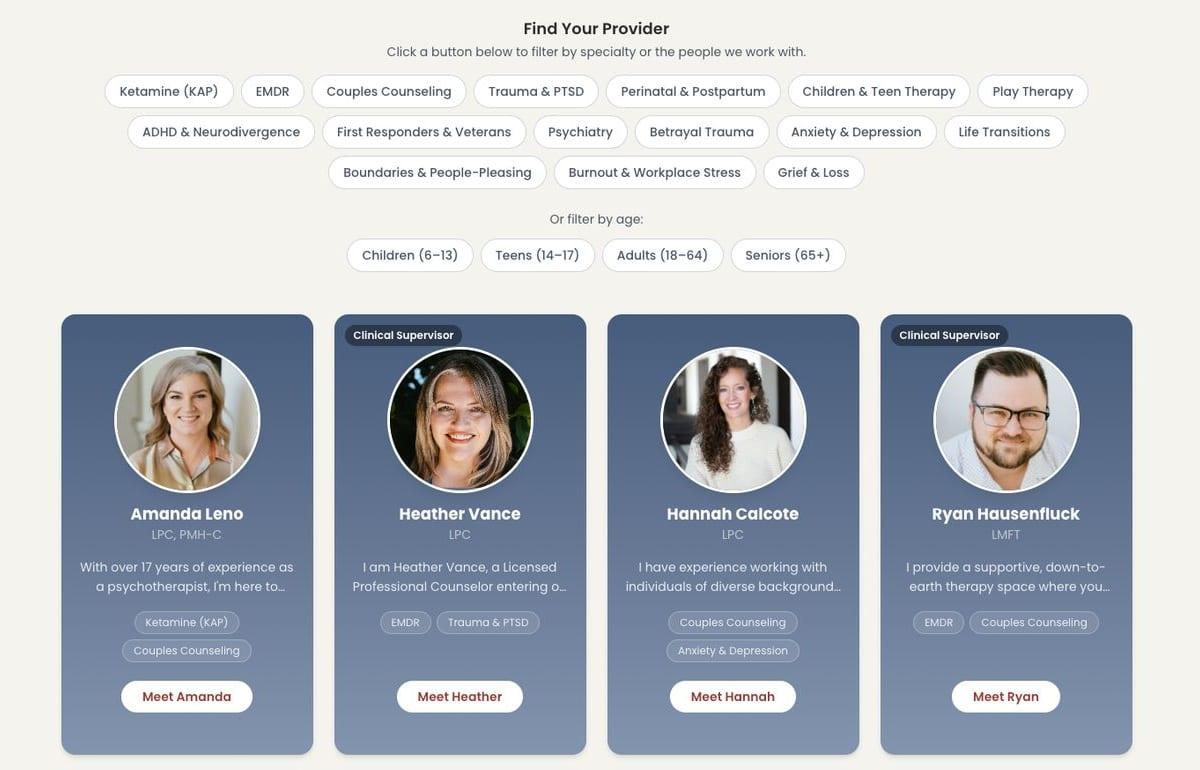
Bios that book, and a team page people can actually filter.
On a Premium annual plan, TheraSaaS builds your practice website with a client-facing therapist matching filter on the team page. Prospects narrow by specialty, age, or insurance and land on the right bio, with a booking button wired straight into your intake pipeline.
It's the “browse the menu” page, built to convert.
People skim the front door and read the rooms
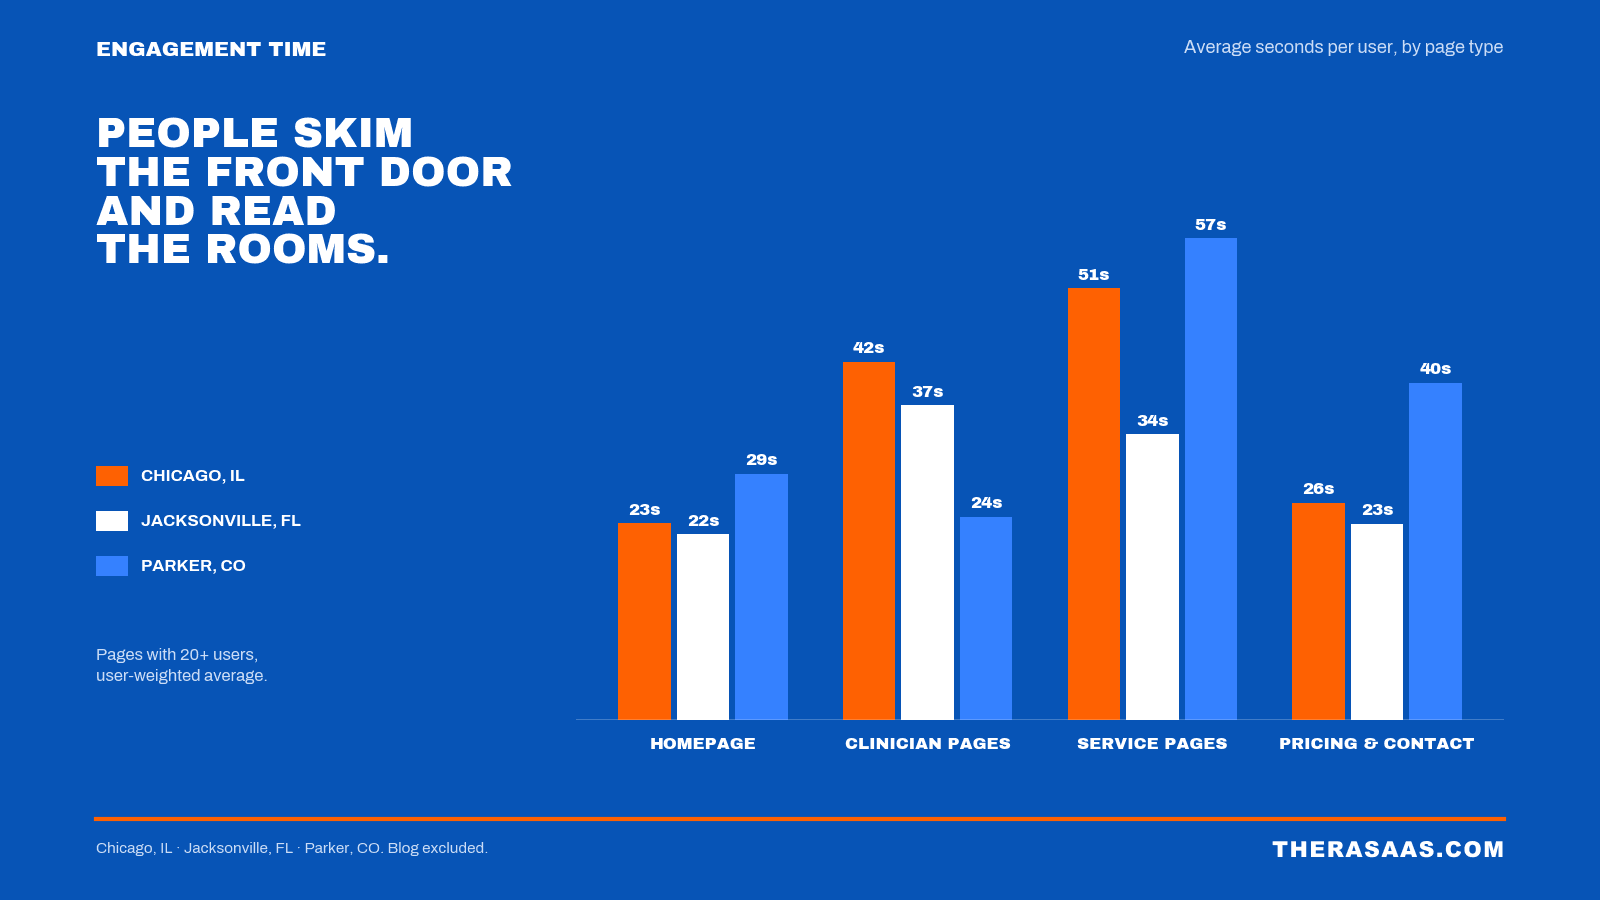
Page views tell you where people go. Engagement time tells you which pages are doing the persuading.
Engagement time
People skim the front door and read the rooms.
Average engaged seconds per user. Hover a bar for the figure; click a city to isolate it.
Homepage
Clinician & team pages
Service pages
Pricing & contact
Pages with 20+ users, user-weighted. Blog excluded.
Source: Google Analytics 4, 90 days, 3 practices · TheraSaaS.com
The homepage gets skimmed. It ran 22 to 29 seconds on all three sites.
That's normal. The homepage's job is to route people, not to hold them.
The pages that hold people are the ones where a real decision gets made:
- Service pages: 34 to 57 seconds. One Chicago service page, child trauma therapy, averaged 211 seconds. Long engagement on a service page means the copy is answering real questions.
- Clinician and team pages: 24 to 42 seconds. On the two sites with strong bios, people read them for nearly twice as long as the homepage. On the site where several bios sat at 15 to 20 seconds, those bios weren't giving anyone a reason to stay.
- Pricing and contact: 23 to 40 seconds. Which brings us to the page everyone argues about.
The pricing page is a checkpoint, not a hurdle
A pricing, payment, or insurance page was a top-4 page on all three sites. People spent 25 to 49 seconds on it.
In Parker, the payment and insurance page was the number-two page on the entire site.
Read that path again. Homepage, then can I afford this and do you take my plan, then meet the team, then one or two bios, then contact.
Parents check the money question before they read a single bio.
Hiding your rates doesn't stop anyone from asking. It sends them to the practice down the street that answers the question.
So put the rates on the page. Name the insurance you take, or say plainly that you're out of network and what that means for a family.
Then let the pricing page do its job, which is to qualify the right people and move them along to your team.
What to do this week
- Pull your own top 10. In GA4: Reports → Engagement → Pages and screens, last 90 days. Download the report and throw it into your favorite LLM. If your homepage, bios, services, and pricing aren't the top of that list, something is broken. If they are, that's your priority list.
- Rewrite your clinician bios like landing pages. A current photo. A "who I help" section in plain language. Specialties and ages served. A book button on every single one.
- Give your team page homepage-level care. It's the page people return to most. Add filters for age, specialty, and insurance so a visitor can find their person in two clicks instead of ten.
- Put the money question on the page. Rates, insurance, out-of-network policy. It was top-4 on every site we looked at, so stop making people hunt for it.
- Configure your key events. New-client form, appointment request, phone tap. If your analytics can't tell you how many inquiries came in last month, that's the fix to make first. It takes about ten minutes.
Your blog might bring the traffic. Your pages bring the clients.
Optimize accordingly! 💡
Want to see what this looks like on your site?
Bring your GA4 top-10 to a 40-minute demo. We'll walk through your homepage, bios, and pricing page against these numbers, then show you how TheraSaaS wires each one to your intake pipeline.
About the data: three TheraSaaS-built practice websites, Google Analytics 4, June 10 through September 7, 2026. 22,833 total page views, and 14,611 after excluding blog pages. Practices are identified by city only. Engagement figures are user-weighted averages for pages with 20 or more users. Team pages are classified with clinician bios.